Note
Click here to download the full example code
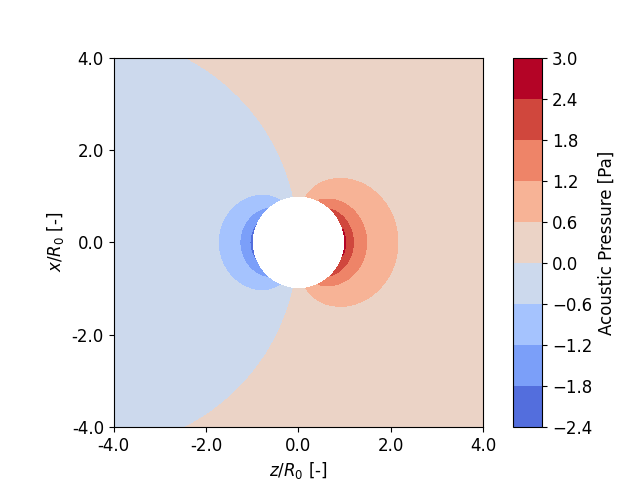
Acoustofluidics 2022: Minimal Example Plotting Scattering Fields#
This is the minimal example on how to plot the scattered pressure field around a polystyrene particle suspended in water and subjected to an acoustic standing wave from the abstract book from the Acoustofluidics 2022 conference.
We import osaft and initialise the model from Yosioka & Kawasima.
12 from matplotlib import pyplot as plt
13
14 import osaft
15
16 yosioka = osaft.yosioka1955.ScatteringField(
17     f=1e6,
18     R_0=1e-6,
19     rho_s=1020,
20     c_s=2350,
21     rho_f=997,
22     c_f=1498,
23     p_0=1e5,
24     wave_type=osaft.WaveType.STANDING,
25     position=osaft.pi / 4,
26 )
The model is passed to the plotting class and the pressure field is
plotted. The option incident=False makes sure that only the
scattered field is plotted but not the incident field.
33 plot = osaft.FluidScatteringPlot(yosioka, r_max=4e-6)
34
35 plot.plot_pressure(incident=False)
36
37 plt.show()
Total running time of the script: ( 0 minutes 0.619 seconds)
Estimated memory usage: 29 MB