ARFPlot
Examples using this class are:
- class osaft.plotting.arf.arf_plots.ARFPlot(attr_name=None, x_values=None)[source]
Bases:
objectPlotting different ARF solutions inside same axis over attribute
- Parameters:
attr_name (
Optional[str], optional) – name of attribute for x-axisDefault:Nonex_values (
Optional[ndarray], optional) – x values for axisDefault:NonePublic Methods:
set_abscissa(x_values, attr_name)Setting the abscissa variable and values for the ARF plot
add_solutions(*solutions[, multicore])Add solutions to list of solutions for plotting e.g.
remove_solution(solution)Remove solution of list of solutions for plotting
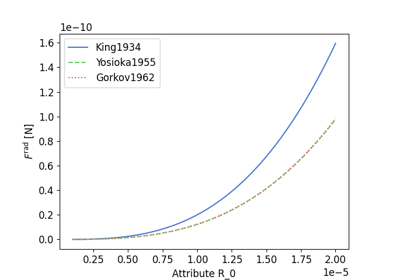
plot_solutions([ax, display_values, ...])Plot all solutions in stack over attribute set via
set_abscissa()or overx_valuesif passed using the plotting methodsplot_method.
- add_solutions(*solutions, multicore=False)[source]
Add solutions to list of solutions for plotting e.g.
osaft.king1934.ARF()- Parameters:
solutions (
BaseARF) – one or multiple solutions, e.g.osaft.king1934.ARF()multicore (
bool, optional) – itTrue, multiple processingDefault:False- Return type:
None- plot_solutions(ax=None, display_values=None, normalization=None, plot_method=<function plot>, **kwargs)[source]
Plot all solutions in stack over attribute set via
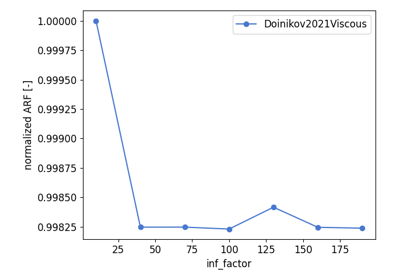
set_abscissa()or overx_valuesif passed using the plotting methodsplot_method. The plot can be normalized if one of the following is passed asnormalization:the name of an added solution:
'max': normalization w.r.t. max value of the ARF in the plota
float: normalization w.r.t. to a numbera
callablenormalization w.r.t. to function that takes the values on the x-axis as an input
- Parameters:
ax (optional) – axes object where plot will be generated
Default:Nonedisplay_values (optional) – changing the values for the x-axis
Default:Nonenormalization (optional) – normalization (see above)
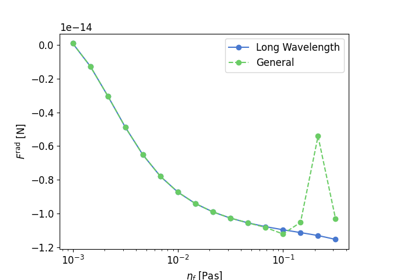
Default:Noneplot_method (optional) – matplotlib native plotting method (e.g.plt.loglog)
Default:<function plot>kwargs – keyword arguments that get piped to
plot_method- remove_solution(solution)[source]
Remove solution of list of solutions for plotting
- Parameters:
solution (
BaseARF) – specific ARF solution, e.g.osaft.king1932.ARF()- Return type:
None
- set_abscissa(x_values, attr_name)[source]
Setting the abscissa variable and values for the ARF plot
- Parameters:
x_values (
ndarray) – data points to be plotted overattr_name (
str) – name of the dependent variable to be plotted over
- Return type:
None
- property attr_name: str
Attribute that is used as x-axis
- Getter:
returns the attribute name for the x-axis
- Setter:
sets attribute name